Indicator Overview
Current Values:
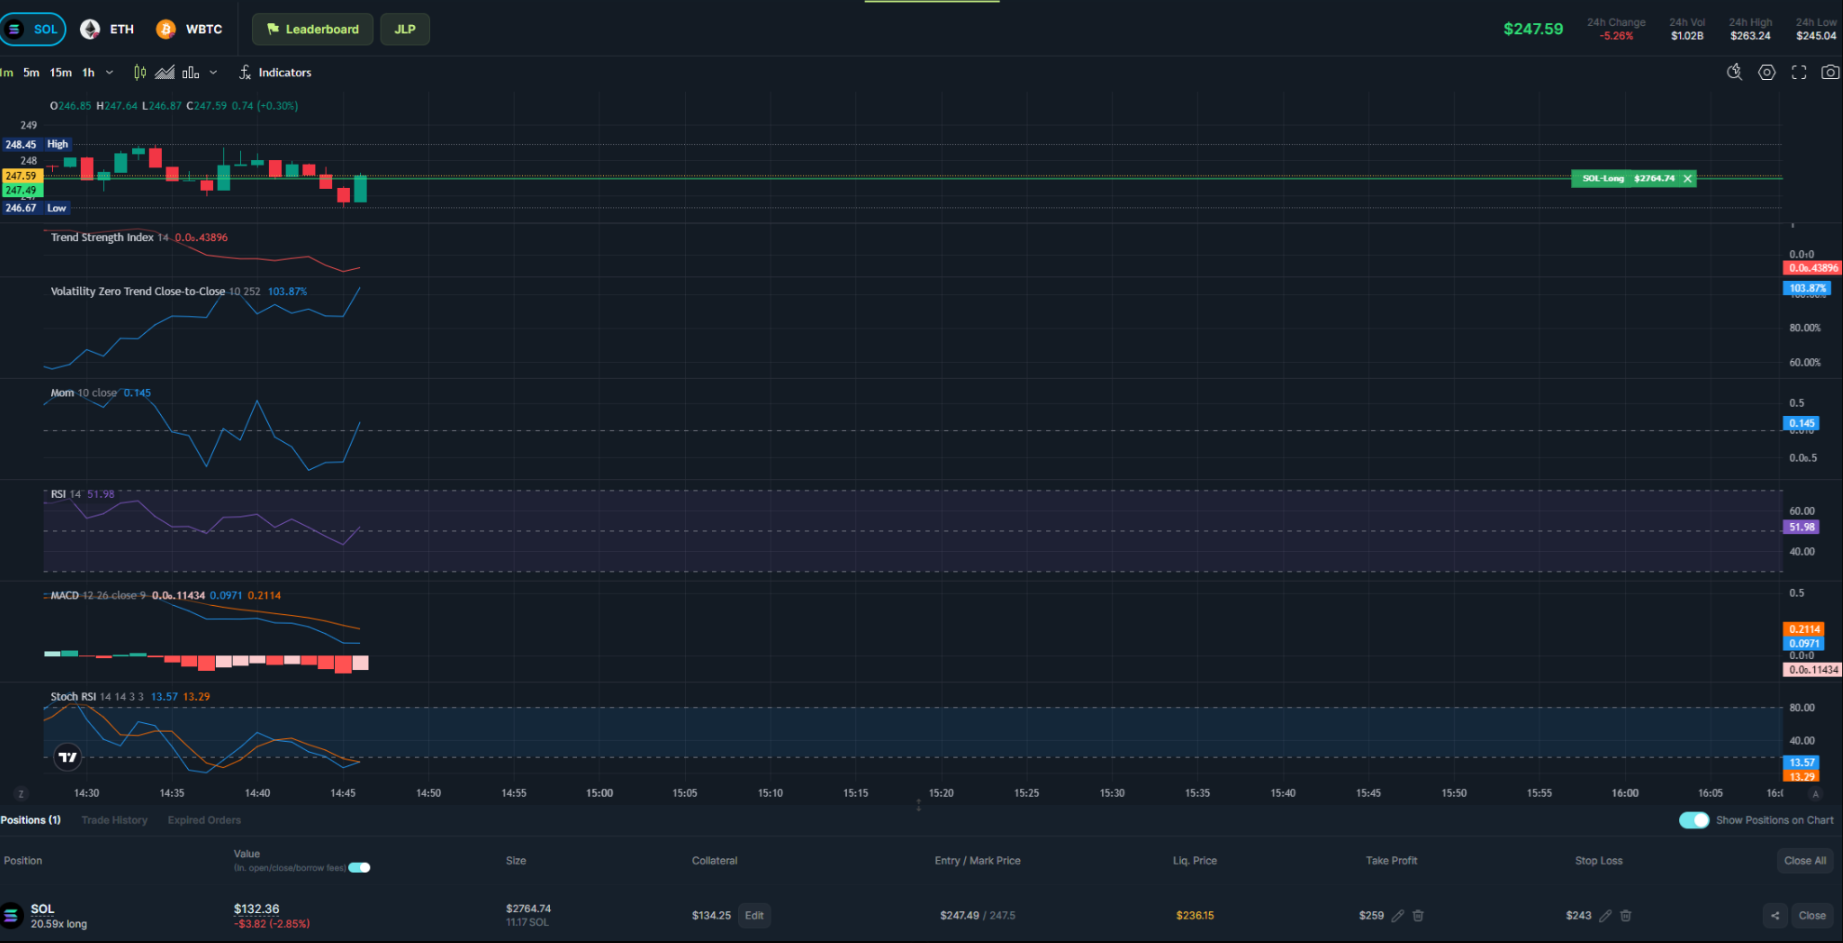
- MACD Line: 0.2114
- Signal Line: 0.0971
- Histogram: Positive (slightly bullish)
Interpretation
When the MACD line is above the Signal line, it indicates bullish momentum. The current slight positivity suggests mild upward pressure.
Key Rules
- MACD Line > Signal Line: Bullish signal.
- MACD Line < Signal Line: Bearish signal.
- Green Histogram Bars: Strong upward momentum.
- Red Histogram Bars: Downward pressure.
Example Chart