Indicator Overview
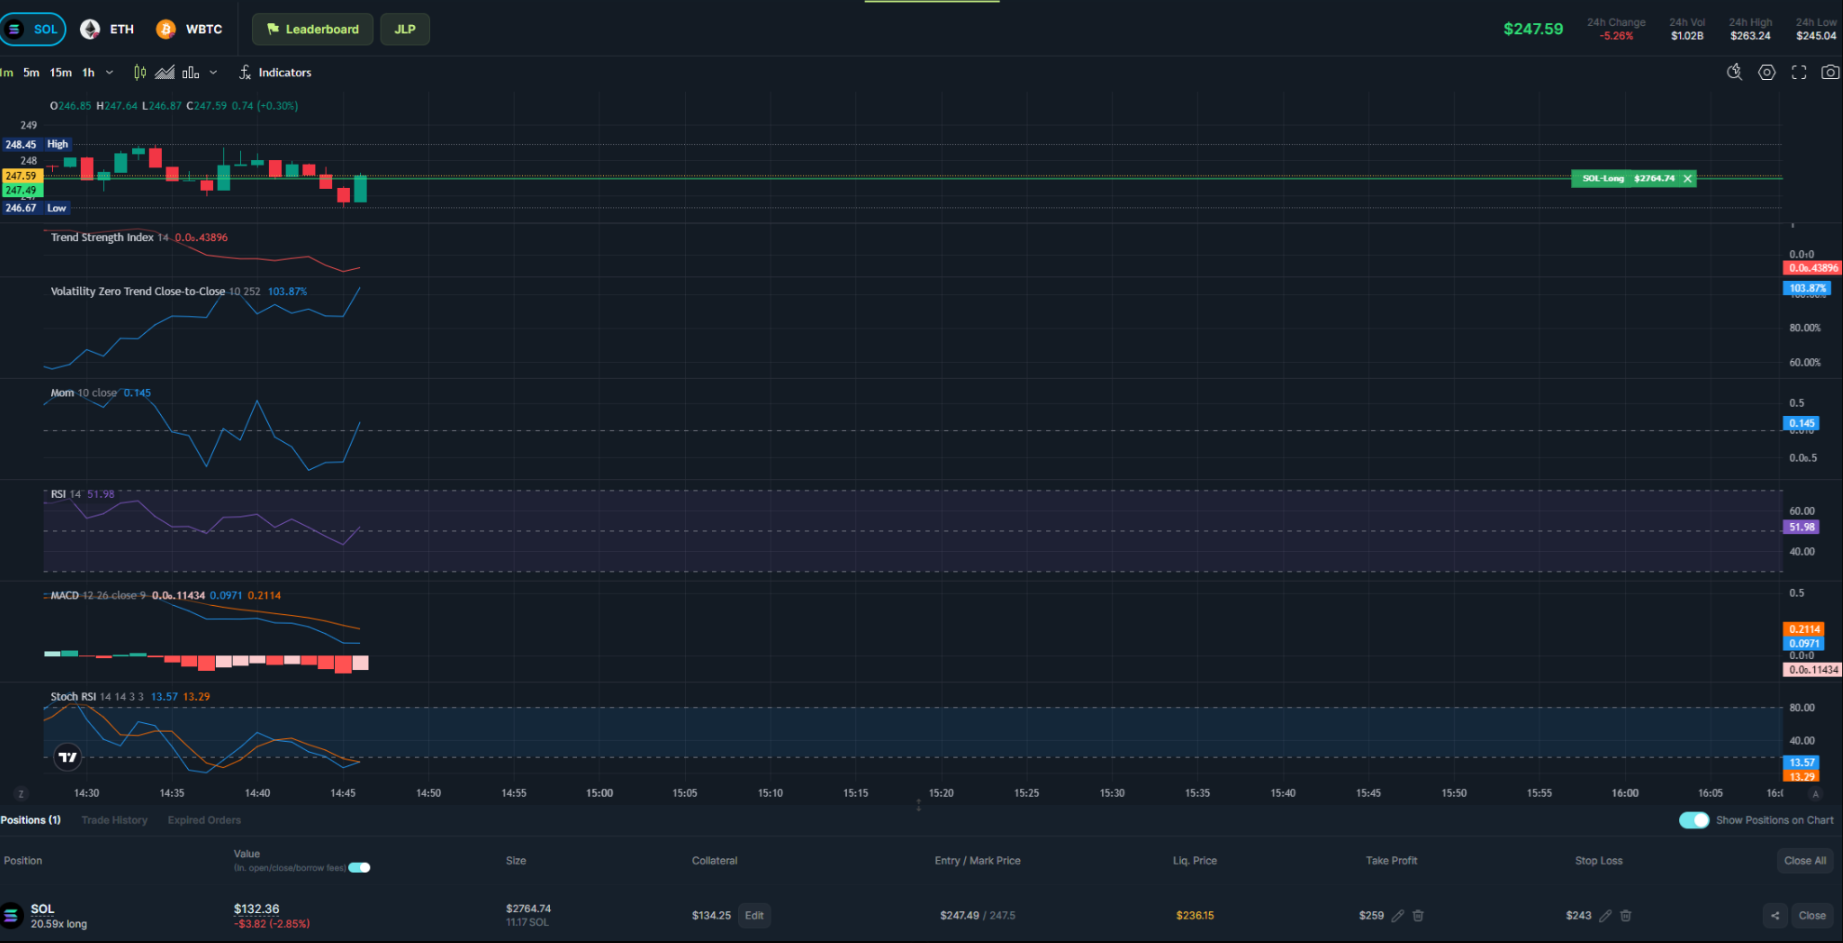
Current Value: 51.98 (Neutral)
The RSI measures whether a market is overbought (>70) or oversold (<30). Values around 50 indicate neutrality.
Interpretation
The market is neither overbought nor oversold, suggesting that prices are in a stable range. This aligns with small fluctuations currently observed.
Key Rules
- RSI > 70: Consider selling or shorting as the market may be overbought.
- RSI < 30: Consider buying as the market may be oversold.
- RSI ~50: Observe for market stability; wait for clearer signals.
Example Chart