Indicator Overview
Current Value: 0.2301 (Neutral)
The TSI measures the strength and direction of a trend. Positive values indicate bullish trends, while negative values indicate bearish trends.
Interpretation
The current neutral reading suggests that the market lacks strong directional momentum. Wait for stronger signals to make a confident decision.
Key Rules
- TSI > 0: Bullish trend; consider buying or holding.
- TSI < 0: Bearish trend; consider selling or shorting.
- Sharp increases or decreases indicate a strengthening trend.
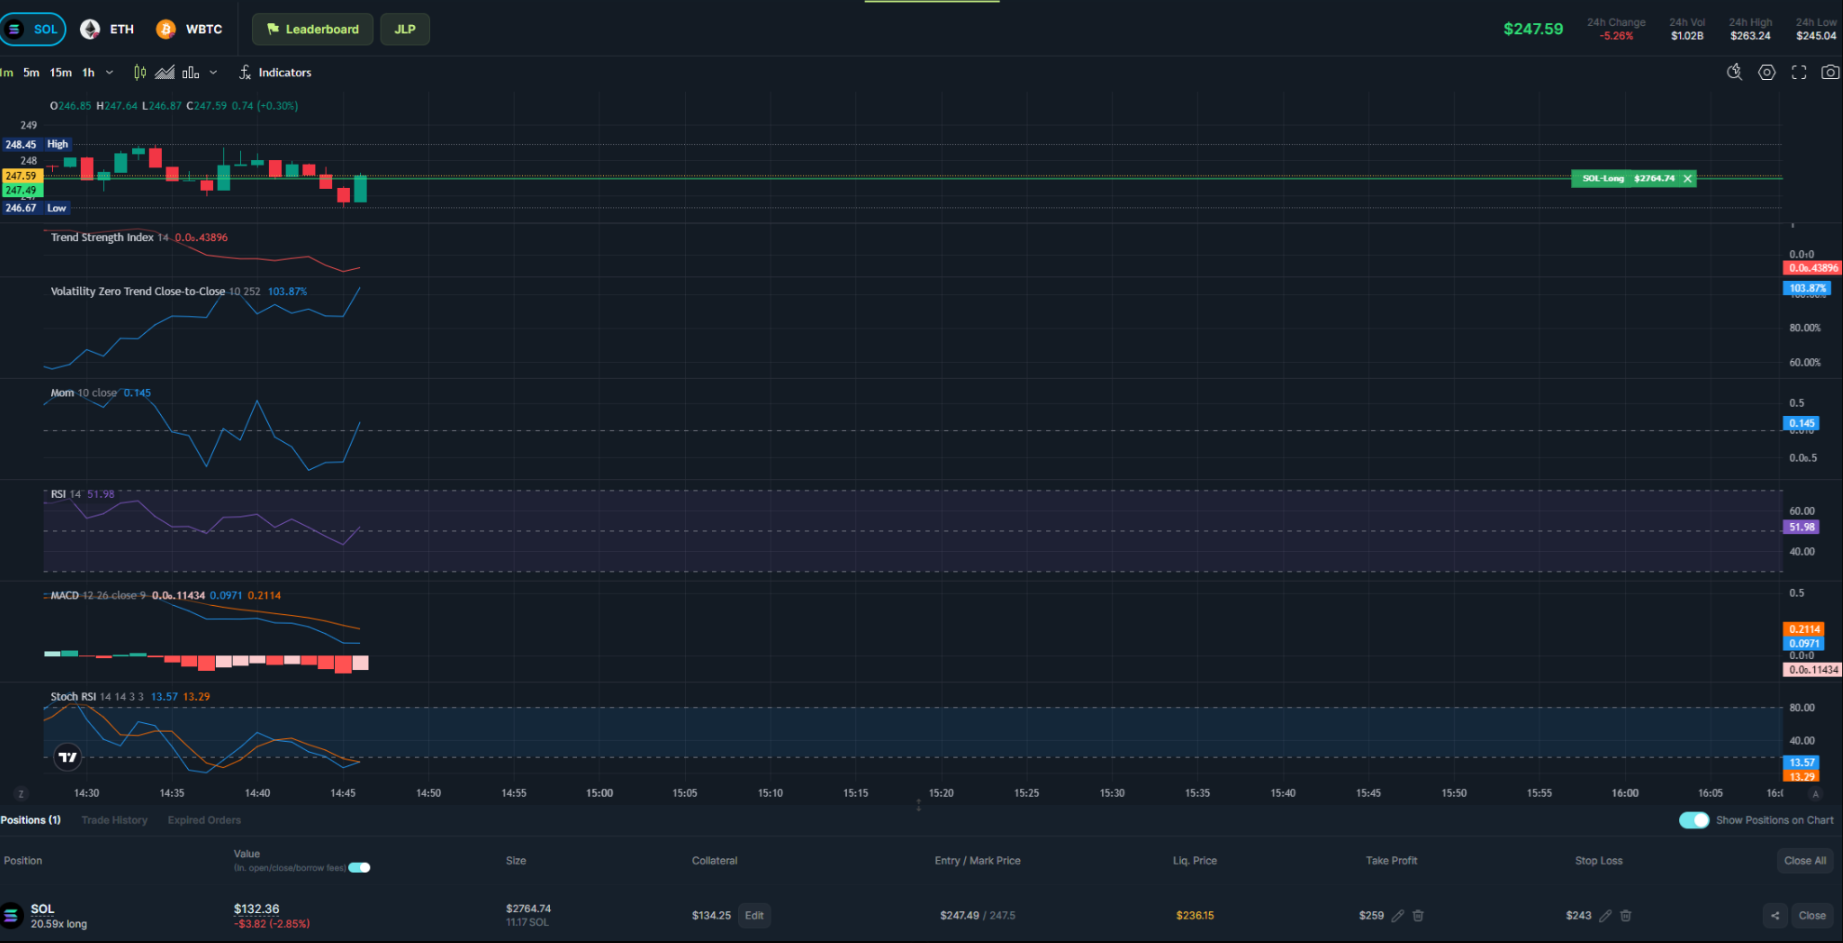
Example Chart